| Doc Number: Beams-doc-4519 |
|---|
| Doc Number: Beams-doc-4519 |
|---|
In order to understand and document the radiation issues in the Main Injector tunnel created by beam losses, we need to measure the activation and residual radiation and relate it to the number and energy of proton losses and the location of those losses. Using MARS simulations, we will, in future, be relating the simulated activation and residual radiation to measured values. In this document, we will establish a technique for relating loss measurements to beam loss so that the activation and residual radiation patterns can be normalized to losses despite changes in the loss patterns resulting from improvements in beam collimation. To understand the accuracy of this loss monitor calibration, we will study patterns of loss distribution with location and time to constrain uncertainties in the overall understanding of the radiation. A preliminary result is the determination that protons lost on the secondary collimators produced an activation of 2.4879E-16 pCi/gm/p on Al Tags placed on the aisle side of the collimator outside of the marble shield. Using this result we find sensitivities for the loss monitors near the secondary collimators.
To understand the activation and residual radiation created by beam loss in the Main Injector, we have recorded the beam intensity in injected and extracted beams as well as the intensity in the machine at various times. Beam Loss Monitor (BLM) measurements reveal the locations where this beam is lost. Residual radiation and activation studies measure the impact of these losses. In order to relate the proton losses to the activation and residual radiation, we need to calibrate the BLM measurements (in Rads) to the proton loss. We identify two features of the Main Injector systems which permit a useful calibration despite many complications.
Beam intensity and beam loss information has been recorded for the high intensity operation of the Fermilab Main Injector with a variety of monitoring software. We will use the data recorded by these programs to provide intensity and some transmission data from June 2004 and loss history for operation after commissioning of new loss monitor electronics in 2006. Al Tag activation studies employ tags installed when the collimation system was installed in 2007 with tags removed after 1, 2, and 3 years. Emphasis will be on the NuMI era which began in May 2005 when operation for NuMI began until the shutdown on 30 April 2012. We will study the relation of loss monitor measurements to the number of protons lost. This is in preparation for comparing radiation measurements with MARS simulations. For cross checks, we will examine various combinations of the intensity and loss information.
For proton intensity measurements we have toroids from the injection and extraction lines [1] and we have various samples of the DC Current Transformer (DCCT) readings [2],[3] while the beam is in the machine. Loss data is available at the end of each cycle from each loss monitor [4]. Data from the sum around the ring and from the collimator region after injection and after uncaptured beam loss is available for most cycles [5]. These sums are also available at the end of the cycles for nearly all cycles. Using I129 [5], studies of one or a few pulses record loss data at selected times in the cycle for all BLM channels and software to provide spatial sums is also available. Data has been recorded using the D43/D44 Datalogger system and additional data is available using the Beam Budget Monitor (BBM) via D105. The accounting issues due to various logging anomalies will require examining the various available cross checks. We will provide a measurement of the 8 GeV proton beam loss at the collimators for comparison with the activation measurements and the MARS simulation of those measurements.
We begin by introducing the various measurement systems and the way in which the D43/D44 data logger system has been used to record their values. We find that some devices are collected in a manner suitable to take weekly sums whereas others have sufficient mis-information that we choose to use ratios which we then apply to the weekly sums of other quantities. Studies of the residual radiation and cooldown use the datalogger data but "scrub" it to provide sums and weighted sums in the I130 application program (with further developments in W89). We note that all of the beam intensity devices which we use for this study report result in units of 1E12 protons or Tera protons (Tp) except for the BBM which reports sums in protons.
We wish to determine the beam losses. Using DCCT and toroid information we can measure the loss as differences. The transmission of beam bunches directed to the PBar target is of order 91% and pbar beam is about 20% of the beam on a mixed mode cycle. Bunches directed to the NuMI target have 95% transmission and are 80% of the beam in that cycle. In addition to fundamental accuracy limitations of the beam intensity measurements at about the 1% level, we have bookkeeping limitations adding 1% or more to the uncertainties. So if we have loss of 5% +/- 2% (1% on incoming, 1% on outgoing) on a NuMI only cycle we are able to determine the loss to about 40%. On mixed-mode cycles this reasoning may suggest an accuracy of 36% or so. Accuracy of the DCCT may permit better comparisons between different samples from it. We will attempt to do better with various cross checks to limit some of the errors. In particular, the uncaptured beam loss, as determined by the DCCT may help determine a calibration for the BLM sums which might be applied back to the overall BLM loss determination. Let us see how well we can carry this through.
The beam in the MI8 line is measured by toroids on each of the 11 or fewer Booster batches per Main Injector cycle. The MI8 Collimator system scrapes a portion of the beam so we will employ a toroid which is downstream of that location. I:TOR852 (using an MADC digitization) was used until recently . The digital version I:TR852D is employed by the end of this running period. Data from I:TOR852 is also available from the BBM. A sum is collected for each Booster event type for each MI Cycle.
These pseudo-devices were implemented in a reliable fashion late in the operating era but for most of the data of interest, they miss Booster cycles and thereby report too low a value on a fraction of the MI cycles. However, plotting the ratio to a well measured device using appropriate limits on the ratio produces a useful result. One selects a limited range in the ratio corresponding to the well-measured ratio. We employ the target toroid for the event which provides an overall efficiency for beam to that target.
Software which monitored beam transmission showed that time-of-day dependent calibration effects modified the results from I:TOR852. This was determined using the D43/D44 datalogger system and confirmed and corrected by having I124 calibrate I:TOR852 based on the DCCT results for the first injection. Effects at the 1% level were correlated with the temperature at the MI10 service building. The history of this correction is not conveniently available and will not be employed here. Phil Adamson studied these effects and provided the I124 software.
The datalogger contains some information from two toroids for PBar beam. We will employ M:TR105B as stored on Ev 81 with 200 mSec delay. Ev 81 is Deb:Transfer MI to target. As a cross check or when that is not available, we examine I:TORF16. For NuMI [1] we choose E:TORTGT on Ev AD with delay 1500 mSec where Ev AD is NuMI:Extraction reset. The BBM employs M:TR105B for beam delivered to the PBar target and E:TOR101 for NuMI delivered intensity. It will be consulted for cross checks as well. At various times some data loggers `died' and other data must be consulted to complete the record. This document will not contain all the details. Notes on most changes will be available in a text log file.
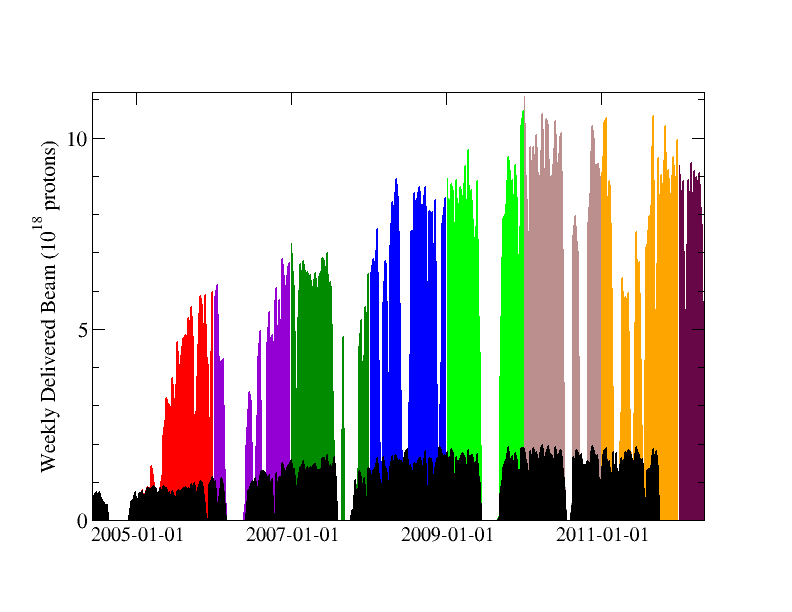
We will discuss below the various efforts required to get intensities and losses. Here, let us present data on the weekly beam intensity sums. Data for various events was logged in various eras. We found that some loggers were missing for a day or more various times but after June 2006, we could adequately reconstruct the beam delivered to PBar and NuMI targets and from that sum to provide a weekly delivered beam record. We found that is some eras, the backup system for the dataloggers gives evidence of some unresolved faults such that requesting data with no requirements reveals some data is stored, no available selection will identify which data is there and thereby removes any hope of obtaining usable weekly sums. Using D105 (BBM), we can get weekly sums which we can pass with e-mail. While cumbersome and modestly time consuming, we find that this is the available way to create spreadsheets (for comparisons) and lists for plotting which should describe the delivered beam intensity sums. In the figure the black indicates the weekly beam sum delivered to the Pbar target while the colored data are weekly sums of PBar plus NuMI with change in color for each year. These are stacked bar plots so the total weekly beam is at the top of the bar.
Stored with this document are a spreadsheet and text file containing this data:
We have described in Beams-doc-3299 [5] a set of pseudo-devices which separate the loss monitor sums into regions and time slices. We have these sums recorded at PROFILE 0 (which is normally set at $22 which is end of injection or start of ramp), PROFILE 1 (after 1.5% acceleration) and at the end of the cycle. These settings of PROFILE 0 and PROFILE 1 are chosen to match the break points in the orbit correction ramps. These sums are calculated at the end of each cycle and datalogged to provide I:LMCOL0, I:LMCOL1 and I:LMCOLL for the collimator region, I:LMRNG0, I:LMRNG1 and I:LMRING for the rest of the loss monitors and I:LMSUM0, I:LMSUM1 AND I:LMSUM for total values. While it would be lovely to have such time separation for each loss monitor, we didn't provide such detailed records. The profile times have many uses so they are set to the inappropriate sample times when the Main Injector is employed for transfers of antiprotons from AA to RR or other `interruptions' to the standard PBar stacking cycles. If mixed mode $23 cycles are in the time line, the PROFILE times are returned to the values required for these loss sums on $23 cycles at the end of transfer operations. If there are only PBar $29 cycles in the time line, then PROFILE times suitable for them are loaded as needed. But during the PBar transfer efforts, we have useful values of I:LMCOLL, I:LMRING, and I:LMSUM but the application program knows to not record values for the PROFILE 0 and PROFILE 1 samples when the times are `mis-set'.
As employed in Beams-doc-3980 [7], half life weighted sums of the losses are used to relate activation to residual radiation. Using the Al tag activation to confirm the beam loss, we compare the unaccelerated beam to the BLM sums for calibration purposes. We will move through this in several steps.
We begin with some overview of the intensities and losses.
MARS calculation for the Main Injector Collimators have been carried out using some aggressive assumptions for the intensities as prescribed in TM2391[6] where a per cycle intensity of 5.5E13 protons per cycle or 2.5E13 protons per second result in 7.89E20 protons per year accelerated taking 100% operating up time. Using a 95% transmission or 5% loss at 8 GeV we loose 1.25E12 protons/sec or 3.94e19 per year. These are allocated to the secondary collimators per the STRUCT results. In Table 2, Page 9 we find
| Collimator | Beam Loss (%) | Annual Loss |
|---|---|---|
| S1 | 28 | 1.10E19 |
| S2 | 40 | 1.58E19 |
| S3 | 10 | 3.94E18 |
| S4 | 22 | 8.68E18 |
The Al Tag activation measurements included tags at 15 locations which were collected after intervals of 1, 2 and 3 years exposure. Collimation commissioning, which started in January 2008, supported only lower intensities in the first year. Improved collimation orbits re-distributed the losses as time went along. Here are some details:
Tags placed  10/12/2007
Collected 1  10/8/2008  362 Days
Collected 2  8/26/2009  684 Days
Collected 3  8/12/2010 1035 Days
The analysis of Al Tag activation is reported in Beams-doc-3980 [7]. We will use this data in the next section to provide a basic calibration of the BLM system.
Using the data from the Beam Budget Monitor application page D105, we find the following measured results for the beam lost in this time.
| Aluminum
Tag Dates |
Year 1 |
Year 1&2 |
Year 1,2&3 |
Year 2 |
Year 3 |
| Install |
10/12/2007 |
10/12/2007 | 10/12/2007 | ||
| Remove |
10/08/2008 |
08/26/2009 |
08/12/2010 |
||
| Days |
362 |
684 |
1035 |
322 |
351 |
| Beam
Budget Monitor Data |
|||||
| Injected
Beam |
|||||
| I:TOR852 |
2.96E20 |
5.79E20 |
9.87E20 |
2.83E20 |
4.08E20 |
| Delivered
Beam |
|||||
| M:TOR105B (PBar) |
6.54E19 | 1.21E20 |
1.92E20 |
5.56E19 |
7.10E19 |
| E:TOR101 (NuMI) |
2.03E20 |
4.04E20 |
7.14E20 |
2.01E20 |
3.10E20 |
| Delivered
Sum |
2.68E20 |
5.25E20 |
9.06E20 |
2.57E20 |
3.81E20 |
| Results |
|||||
| Beam Lost |
2.76E19 |
5.40E19 |
8.10E19 |
2.64E19 |
2.70E19 |
| Transmission |
0.907 |
0.907 |
0.918 |
0.907 |
0.934 |
| Compare
-- [Measured/TM2391] |
|||||
| Lost Protons |
0.700 |
0.669 |
0.684 |
||
| Delivered Protons |
0.358 |
0.342 |
0.508 |
Note that TM-2391 assumed a much higher delivery rate but smaller loss rate with the product being a higher-than-delivered total loss.
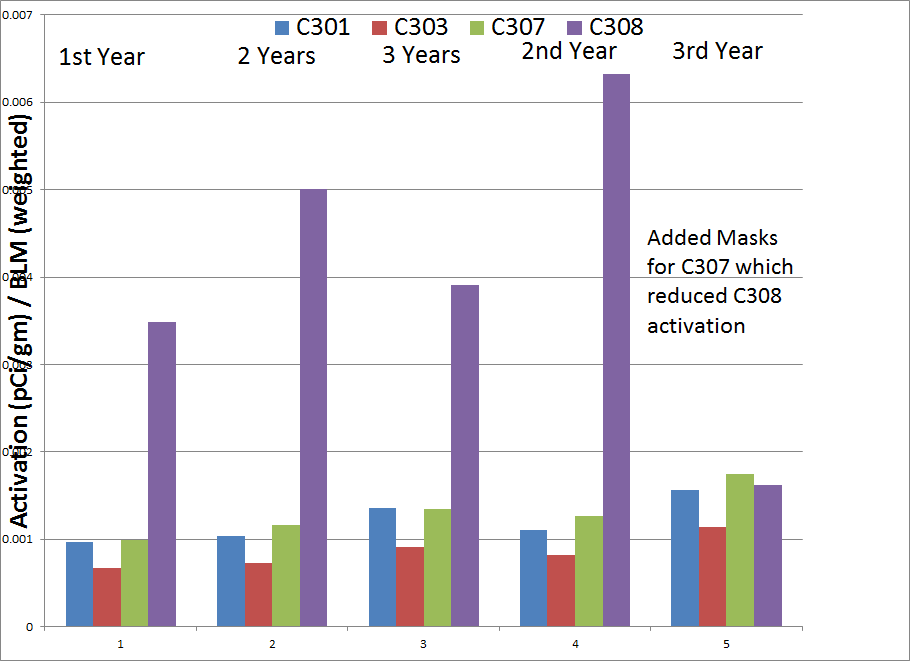
The assumption that losses and activation were dominated by the protons deposited in the collimator region was apparent after initial collimation tune-up. We reported collimator efficiency in the HB2008 paper [8]. The assumption that the activation was separable into portions due to the four secondary collimators separately was manifestly false in early operation and only became even approximately true after masks were added to absorb outscatter from C307 (third secondary collimator) in a 2009 shutdown.
The Al Tag activation studies reported in Beams-doc-3980, employed the BLM history only for providing suitable isotope decay history to correct the activation. But the geometry of the BLM placement combined with the placement of the first three secondary collimators suggests that the Al Tag activation should be proportional to the adjacent BLM with the same constant (calibration). We relate C301 to LI301, C303 to LI303, C307 to LI307. We expect the loss measured by LI309 to be due entirely to the C308 proton losses but the geometry is entirely different. The analysis spreadsheet for Beams-doc-3980 was modified to provide these ratios (Spreadsheet AlActDataNewAnal.xls included in this document). Fig. 2 shows the results of comparing the activation (corrected for decay) of the Al Tag on the side of each collimator divided by the integrated BLM signal recorded at the corresponding loss monitor for the the tags removed at each location after one, two, and three years. We then get results for the second and third years by taking suitable differences. The time period is identified at the top of the graph.
|
The surprising difference for `3rd Year' is easily understood as due to physical changes in the collimation system during the 2009 Facility Shutdown. The initial configuration was designed for losses due to uncaptured beam. Design simulations, as shown in Table 1, showed that S3 (known as C307) was less important for these losses. The masks (STCM, STMM) [9] which were placed to absorb outscattered beam in the forward direction were installed for C301, C303, and C308. However, the system was removing additional losses (injection, lifetime) for which C307 was very significant. The next magnet from C307 is the H308 trim. The routine bar-coded location monitoring [10] of that corrector found it to become the hottest monitoring location in the ring. Following the installation of STCM307A and STCM307B masks in 2009, the residual radiation at H308 dropped by a factor of ten. This is between the 2nd and 3rd year of the Al Tag monitoring data. We see that the activation on the aisle side of C308 was dominated by the outscattered beam from C307 until we installed the 307 Masks.
Based on Fig. 2, we will begin our calibration effort to relate proton loss to activation and residual radiation. First we note that the activation at C301, C303, and C307 normalized to the LI301, LI303, and LI307 loss monitor sums was nearly the same for each year. Activation divided by BLM sum is about 50% higher in the 3rd year but we would describe this as suggesting the the BLM readings for the same lost protons were (perhaps) lower due to a more efficient collimation orbit setting. Let us proceed by using the 50% differences as a scale for uncertainty. We have a total beam lost for the 3rd year. Let us take the activation sum for Al Tags as C301, C303, C307, and C308 and our assumption that all losses were at these collimators to derive an calibration of pCi/gm (at the side location of the collimators) per lost proton.
Assume all protons are lost on the four secondary collimators and that
the loss is confined to that collimator region. If the activation
at each secondary collimator is due to the loss at that collimator (as
we assume to be true after the 307 mask installation in 2009) then we
sum the activation for the 3rd year and compare it to the BBM sum of
protons lost in that year for an initial calibration of the activation
(Al Tag on aisle side of secondary collimator) per proton lost in that
collimator. Note that we will use the activation corrected
(enhanced) for decay.
| Sum of Activation | 6717.286351 | pCi/gm |
| Total protons Lost | 2.7000E+19 | protons |
| Activation/proton | 2.4879E-16 | pCi/gm/p |
Using that calibration and the activation in the 3rd year of the Al Tag
study we can calculate the number of protons lost in each collimator in
the 3rd year and divide that proton loss by the BLM loss (in
Rads) for that period to calibrate the BLM in protons/Rad. We
will wish to use the measured BLM loss in Rads without the corrections
applied for isotope decay.
| Collimator | BLM | Activation | Col Loss | BLM sum | BLM Calib |
|
|
|
pCi/gm | protons | Rads | p / Rad |
| C301 | LI301 | 1271.967835 | 5.1126E+18 | 815653.2384 | 6.2682E+12 |
| C303 | LI303 | 2401.201048 | 9.6516E+18 | 2159542.426 | 4.4693E+12 |
| C307 | LI307 | 1142.780371 | 4.5934E+18 | 700322.112 | 6.5590E+12 |
| C308 | LI309 | 1901.337097 | 7.6424E+18 | 845611.4016 | 9.0377E+12 |
The naive expectation is that by geometry, the loss monitors at 301, 303, and 307 will have the same sensitivity to a proton lost in the associated collimator. Ignoring the uncertainties in determining the proton loss from the activation, we find that the average response of the three BLM's is 5.77 Tp/Rad or 0.173 Rad/Tp. We find that for the same activation, LI303 is 44% more sensitive than the average of LI301 and LI307, which agree with each other to ~5%. We presume that this represents small geometry differences which we have not carefully noted. However, it would also be consistent with assuming that the Al Tag activation (on the aisle side of the collimator) is determined by the loss at that collimator but that some of the radiation reported by LI303 is due to loss at C301, giving a higher BLM reading and for this analysis a lower BLM calibration. We comment that LI309 is 41% less sensitive to loss at C308 than the average sensitivity of LI301 to C301 and LI303 to C303. This is just a convenient accident due to the forward production of secondaries (vs. backward for 301, 303, and 307) being compensated by the greater distance between LI309 and C308.
For now we assume that the BLM response at these loss monitors are
independent and that they measure the loss at the collimator indicated
in the above table, we can calculate the loss indicated by the BLM in
each year. In the next table we calculate that proton loss from
the BLM loss and sum the four loss monitors for comparison with the
BBM loss total. Implicit in this is the assumption (surely not highly
accurate) that the masks added for C307 have little impact on the
response of these Beam Loss Monitors.
| Loss Monitor |
1st year loss |
2nd year loss |
3rd year loss |
| Rads |
Rads |
Rads |
|
| LI301 |
258874.9632 |
264772.9728 |
815653.2384 |
| LI303 |
1266726.384 |
1114510.925 |
2159542.426 |
| LI307 |
363648.096 |
697641.6384 |
700322.112 |
| LI309 |
521118.0576 |
757858.5504 |
845611.4016 |
| 1st year loss | 2nd year loss | 3rd year loss | |
| protons |
protons |
protons |
|
| LI301 |
1.6227E+18 |
1.6596E+18 |
5.1126E+18 |
| LI303 |
5.6613E+18 |
4.9811E+18 |
9.6516E+18 |
| LI307 |
2.3852E+18 |
4.5758E+18 |
4.5934E+18 |
| LI309 |
4.7097E+18 |
6.8493E+18 |
7.6424E+18 |
| Sum |
1.4379E+19 |
1.8066E+19 |
2.7000E+19 |
| BBM sum |
2.76E+19 |
2.64E+19 |
2.7E+19 |
| Fraction |
0.52 |
0.68 |
1 |
The configuration during the first and second years were changing
as we learned to collimate more effectively, accounting in part for
the differences in the BLM sum from the BBM (toroid) sum. This might
be taken to suggest that the collimation captured loss twice as
effectively by the third year. This is not the message of this table,
rather, we note that without any further improved understanding, we
are finding loss sums to within a factor of two. We take this as a
starting point for further consideration. We will examine additional
features using this calibration. But before we continue, we can
instead use the BLM loss sum (in Rads) and calibrate it directly with
the total protons lost in the 3rd Year. This ignores the sensitivity
difference of LI309 but otherwise we will confirm the usefulness of
this approach.
| BLM Sum (Rads) |
4521129.18 |
| BBM Protons Lost |
2.7E+19 |
| Protons/Rad |
5.97E+12 |
| Rads/TProton |
0.1675 |
| Loss Monitor |
1st year loss |
2nd year loss |
3rd year loss |
| Rads |
Rads |
Rads |
|
| LI301 |
258874.9632 |
264772.9728 |
815653.2384 |
| LI303 |
1266726.384 |
1114510.925 |
2159542.426 |
| LI307 |
363648.096 |
697641.6384 |
700322.112 |
| LI309 |
521118.0576 |
757858.5504 |
845611.4016 |
| 1st year loss | 2nd year loss | 3rd year loss | |
| protons |
protons |
protons |
|
| LI301 |
1.5460E+18 |
1.5812E+18 |
4.8710E+18 |
| LI303 |
7.5648E+18 |
6.6558E+18 |
1.2897E+19 |
| LI307 |
2.1717E+18 |
4.1663E+18 |
4.1823E+18 |
| LI309 |
3.1121E+18 |
4.5259E+18 |
5.0500E+18 |
| Sum |
1.4395E+19 |
1.6929E+19 |
2.7000E+19 |
| BBM sum |
2.76E+19 |
2.64E+19 |
2.7E+19 |
| Fraction |
0.52 |
0.64 |
1 |
We see that the gross features of the apparent loss are quite similar despite the obvious differences in the individual calibrations.
Using the BLM study program I129, one can record all the beam loss and BLM readings at each loss monitor an a series of times. As reported in Beams-doc-3980 Section 3 [7], this can be employed for calibrating the response of the BLM's to 8 GeV proton loss. In that document, we carried this out using the assumption that the proton loss be assigned according to sums of the BLM response of nearby loss monitors. One can analyze the same data but with different assumptions. If one assumes that the uncaptured beam loss be ascribed to LI301, LI303, LI307, and LI309 as the total loss and apportion it to the 4 collimators assuming the same response from the 4 assigned BLM's, one get a calibration of 4.14 Tp/Rad or 0.242 Rads/Tp. pfl-11June13-143510-amc01.xlxs has been updated to pfl-11June13-143510-amc01_20140115.xlxs to include this analysis. Also examined is the proton loss calculation using the calibrations of the 4 loss monitors using the results in Table 4. With that we calculate a proton loss in the uncaptured beam time of 1.52 Tp rather than the 1.12 Tp loss recorded by the DCCT. Thus, this independent measurement with I129 finds the loss monitors are about 36% more sensitive than documented in Table 4.
The aluminum tag activation study reported in Beams-doc-3980 [7] employed activation at 15 locations. Four of these were at the aisle side of the secondary collimators as discussed above. In carrying through the activation calculations, it was found that the required statistics made it impractical to proceed to an activation number for each of these locations. We will compare our measurements above with the results for C301 and C303 provided by Igor Rakhno in the document, "Aluminum_tag_activation_Measurement_vs_Calculation.pdf". By default, he selected measured activation in the first year of collimator operation. The collimator positions and beam orbits didn't reach the design configuration which was modeled in STRUCT/MARS until the third year so we will compare to third year tag differences, as shown in Fig. 2, at the locations where the study was performed.
In Table 3, we compared the third year activation sum at the 4 collimators to the proton loss as measured by the 8 GeV and 120 GeV Toroids. We found that the activation per proton was 2.49E-16 pCi/g/p or 2.49E-4 pCi/g/Tp. The proton loss used in the MARS calculation are shown in Table 1. The 2012 calculations used updated geometry from that employed in the 2007 calculations documented in TM-2391 but the proton loss rate and distribution was the same in both calculations. For C301, the MARS calculation finds 697 pCi/g after one year irradiation with 1.10E19 protons lost on this collimator for a rate of 6.34E-5 pCi/g/Tp. For this location the ratio Measured/Calculated is 3.94. For C303, identified as the 2nd collimator, the calculated activation is 1510 pCi/g for the year. Using the loss from Table 1, of 1.58E19 protons, we find that this corresponds to 9.56E-5 pCi/g/Tp. For this location, the ratio Measured/Calculated is 2.60. As simple average of these would give the ratio Measured/Calculated of 3.27.
This document will be circulated as a preliminary view of the calibration. It culminates a long series of studies which examined both intensity and loss measurements. Some the the above text reflects studies which were included in previous drafts of this document but remain to be checked. We anticipate returning to these issues in order to modify the calibrations (correct for unexamined loss information) and improve the error estimates. Further understanding of the relations of various loss monitor responses and data which employs improvements in the MI8 toroid data may be included in a future version of this document. We will pause in this effort to permit consideration of the overall status of our Measurement to MARS comparison. We note that a previous comparison of MARS to Measured BLM response for uncaptured beam also found the MARS predictions to be below the measurements.