Beams-doc-1493
December 8, 2004
Rob Kutschke
This note discusses the response of the BPM VA33 to two shots. In the shot on the afternoon of Dec. 8, 2004, the response looks good. In the shot on the previous afternoon, Dec. 7, 2004, there are some problems.
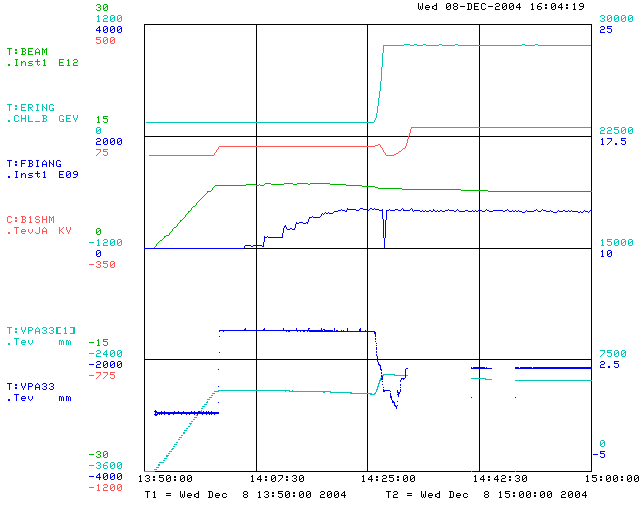
First I will discuss the good shot. The 4 traces in the top half of the plot are not from the BPM and they set the context for the discussion. The bottom two traces are the position and sum signal from VA33.

The top trace shows T:ERING, which starts at 150 GeV and then ramps up just after 14:25. The next trace down shows the voltage on the separator T:B1SHM. On this trace one can see the helix open at about 14:00 and the start of collisions just after 14:25. The green trace shows T:BEAM in which one can see the proton injection and the gradual decay of the beam current with time. The blue trace shows T:FBIANG, which is a measure of the intensity of antiprotons; this shows the anti-proton injection and the gradual decay with time. There is also some sort of glitch just after 14:25.
The cyan trace on the bottom shows T:VPA33[1], the proton sum signal measured on VA33. One can see the proton injection and the energy ramp. The blue trace on the bottom shows T:VPA33, the proton position. One can see the helix open and the initiation of collisions. Both of the bottom plots have drop outs after 14:25 which I presume are due to working being done on the BPM crate.
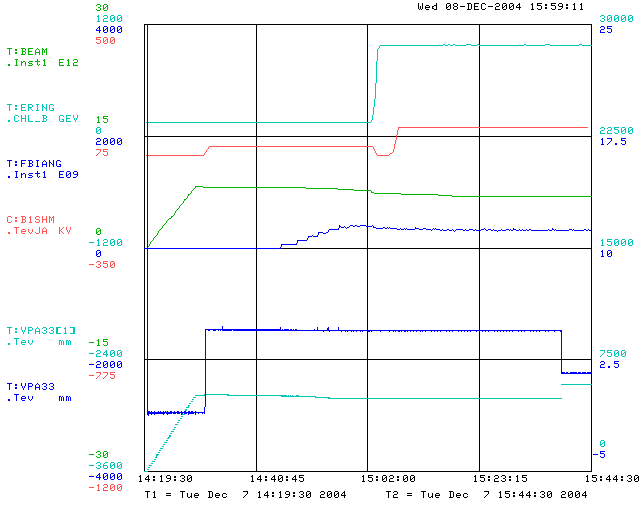
The next plot shows the traces for the shot taken yesterday. Inspection of the 4 top plots shows the proton injection, the anti-proton injection, the energy ramp and the start of collisions.

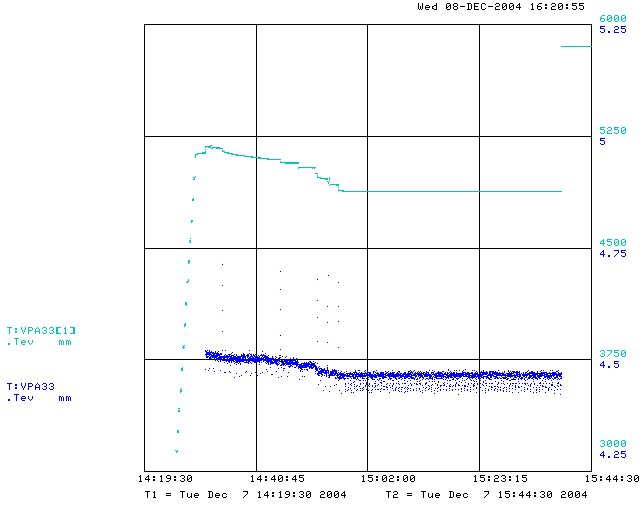
Now consider the bottom plots; the next figure shows them on an expanded vertical scale.

The sum signal (cyan) looks normal until about 14:58, when it stops decreasing and stays almost constant. On the other hand, T:BEAM continues to decrease after this time. There is also another oddity when the sum signal has a jump just before 15:40; look a the top right of the plot for the continuation of the data points. There is no corresponding jump in any of the top four plots at that time.
The position signal also has the jump near 15:40; the data after the jump are off scale in the detail plot. It is hard to tell from this plot alone that the data 14:58 are not meaningful. but my guess is that it is. Note that the position data contains a handful of outliers during the time that the BPM is believed to be operating properly.
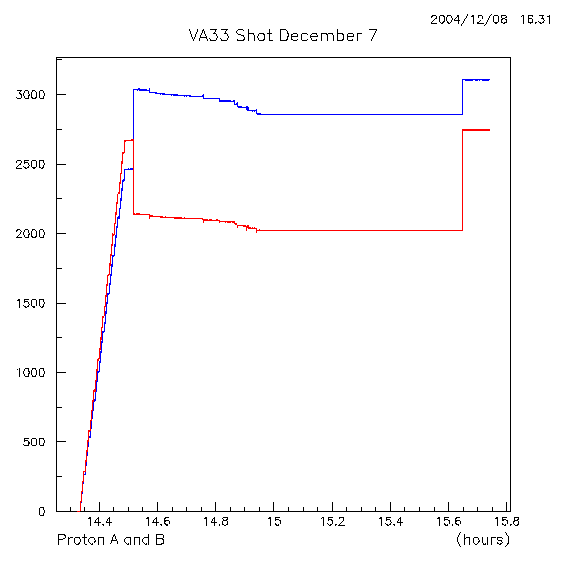
Finally, the last plot shows the magnitudes of A(red) and B(blue) for VA33 for the same time interval as the other plots. The horizontal axis is time in hour of the day.

Summary of the effects to follow up on: